Understanding OpenTelemetry in Industrial Automation: Architecture, Observability, and Operational Benefits
- 〡
- 〡 by WUPAMBO

Industrial control systems are rapidly evolving toward cloud-native architectures and IIoT integrations. Modern manufacturing facilities deploy networked programmable logic controllers (PLCs), distributed control systems (DCS), and edge computing nodes that continuously produce data. Capturing and evaluating operational data from these distributed assets requires standardized monitoring methodologies. OpenTelemetry serves as an open-source framework designed to unify system metrics, activity logs, and execution traces across industrial automation and IT infrastructure.
The Role of Telemetry Data in Modern Automation Infrastructure
Complex industrial automation platforms process high volumes of operational signals to maintain process integrity. Engineers must evaluate controller execution cycles, fieldbus network health, and server workloads in real time. System telemetry comprises three primary data types: metrics, logs, and traces.
Metrics deliver continuous quantitative values, such as CPU load or bus cycle execution times. Logs generate timestamped records of specific hardware or software events. Traces track execution requests as they move across distributed network microservices. Combining these three data streams provides total visibility into plant floor control networks and supervisory cloud platforms.
Architecture and Data Flow of the OpenTelemetry Framework
OpenTelemetry operates through a modular pipeline that ingests, processes, and exports system diagnostics. The application layer utilizes standard APIs and Software Development Kits (SDKs) to capture low-level software events.
The data pipeline flows sequentially through well-defined operational stages:
- Application and Control Nodes: Embedded devices and industrial software generate raw metrics, logs, and trace events during execution.
- APIs and SDKs: Standardized interfaces capture these events without requiring custom proprietary hooks.
- OpenTelemetry Collector Ingestion: Dedicated receivers ingest the incoming data streams from multiple control nodes simultaneously.
- Collector Processing and Enrichment: Internal processing modules filter out noise, batch records, and add context metadata to the collected telemetry.
- Exporter Transmission: Standardized exporters format and transmit the enriched data directly to targeted observability and analytics backends.
This standardized ingestion engine eliminates the need to run multiple proprietary agents on control hardware.
Key Operational Advantages of OpenTelemetry Implementation
- Vendor Independence: Engineers can switch monitoring backends or analytical databases without modifying the underlying controller instrumentation or embedded software.
- Reduced Resource Footprint: Consolidating metric, log, and trace collection into a single framework reduces CPU and memory overhead on industrial edge gateways.
- Standardized Data Schema: Open-source telemetry standards remove software silos between operational technology (OT) networks and enterprise IT systems.
- Accelerated Diagnostics: Unified execution traces allow control engineers to isolate network bottlenecks and controller faults faster.
- Lower Total Cost of Ownership: Eliminating proprietary monitoring software licenses significantly reduces ongoing software lifecycle expenses.
Author Insights on OpenTelemetry Integration in Control Systems
From my experience overseeing large-scale DCS upgrades and plant control networks, monitoring application performance has historically suffered from proprietary vendor lock-in. Traditional automation vendors often restrict diagnostic data to closed software platforms. This limitation forces engineering teams to manage fragmented monitoring tools across different PLC and DCS ecosystems.
Adopting OpenTelemetry represents a fundamental shift toward unified industrial observability. Standardizing telemetry collection allows plant operations teams to feed diagnostic data directly into centralized enterprise dashboards. This open approach improves root-cause analysis during unexpected control system halts and aligns legacy plant equipment with cloud-native monitoring practices.
Industrial Application Scenario: Edge Controller Fault Diagnostics
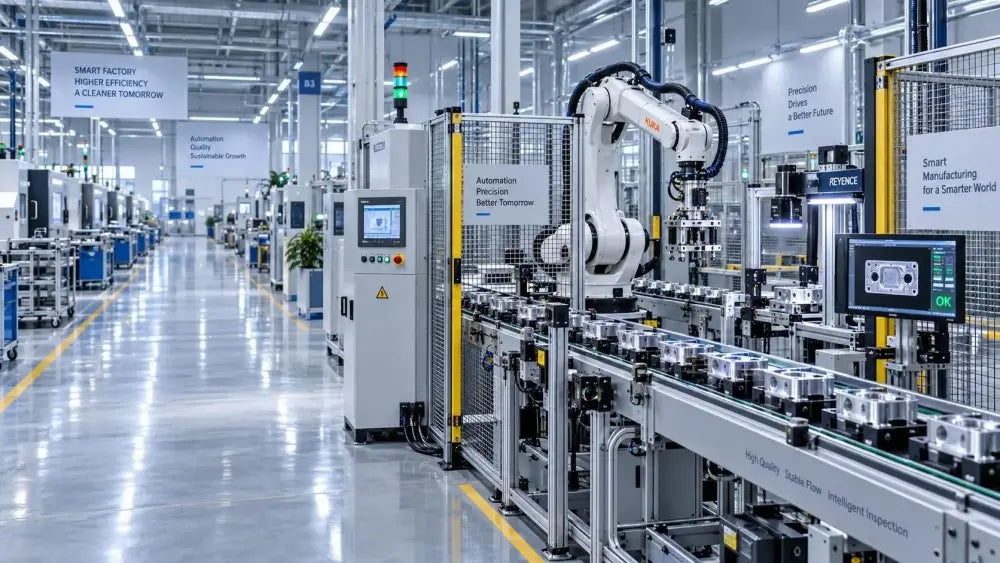
Consider a modern automotive assembly line utilizing edge controllers to manage robot motion and conveyor synchronization. If an intermittent communication delay causes a station trip, traditional logging might only record a generic timeout error on the main PLC.
By implementing OpenTelemetry across the edge controllers and gateway microservices, the system captures a distributed trace of the failure event. The diagnostic trace reveals that an auxiliary vision-processing service spiked CPU usage, which delayed the real-time fieldbus transmission cycle. The engineering team can quickly adjust process priorities and resolve the issue without deploying site engineers for prolonged manual troubleshooting.
- Posted in:
- Control System Diagnostics
- DCS Observability
- Industrial Automation
- OpenTelemetry Architecture